Study Abroad Visualizations
Group members: Lisa Cromwell, Thomas Moran, and Rajan Singh Link: P5.js Visualization P5.js Description: This portion of the data visualization...
Group members: Lisa Cromwell, Thomas Moran, and Rajan Singh Link: P5.js Visualization P5.js Description: This portion of the data visualization...
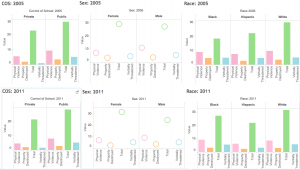
Group Members: Sarah Izzell and Emily Hines Click here to access the link for our project. We chose to do...
Group Members: Julie Gareton and Brooke Wilner Note: clicking on the image will enlarge it. The embed code doesn’t...
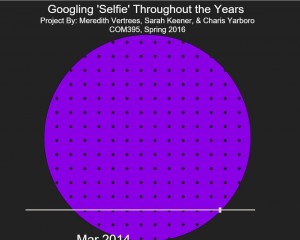
Meredith Vertrees, Sarah Keener, and Charis Yarboro Link to Visualization: http://www.jjsylvia.com/bigdatacourse/googleselfie/ Our group created a data visualization using data from GoogleCorrelate...
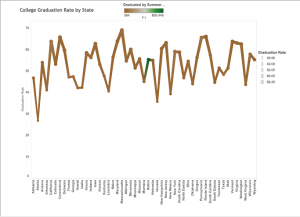
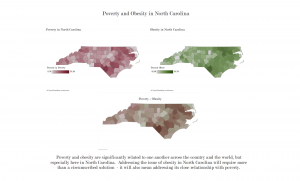
Group members- Cheyenne Taylor, Ellen McMullen, and Ward Williams Our topic for this project is comparing college graduation rates...
For our data visualization, we really wanted to tackle a political component, given the upcoming election later this year. While...

Our data visualization is on the voter statistics of every county in North Carolina. Especially because of this election year,...
Since I had trouble embedding the file where it would work in the blog even after watching the tutorial several...

I do apologize for the super late post. This is an interesting topic and I wanted to respond regardless of...

For this blog post, I want to focus on Facebook. The two groups I keep up with the most are...
Recent Comments