Study Abroad Visualizations
Group members: Lisa Cromwell, Thomas Moran, and Rajan Singh
Link: P5.js Visualization
P5.js Description:
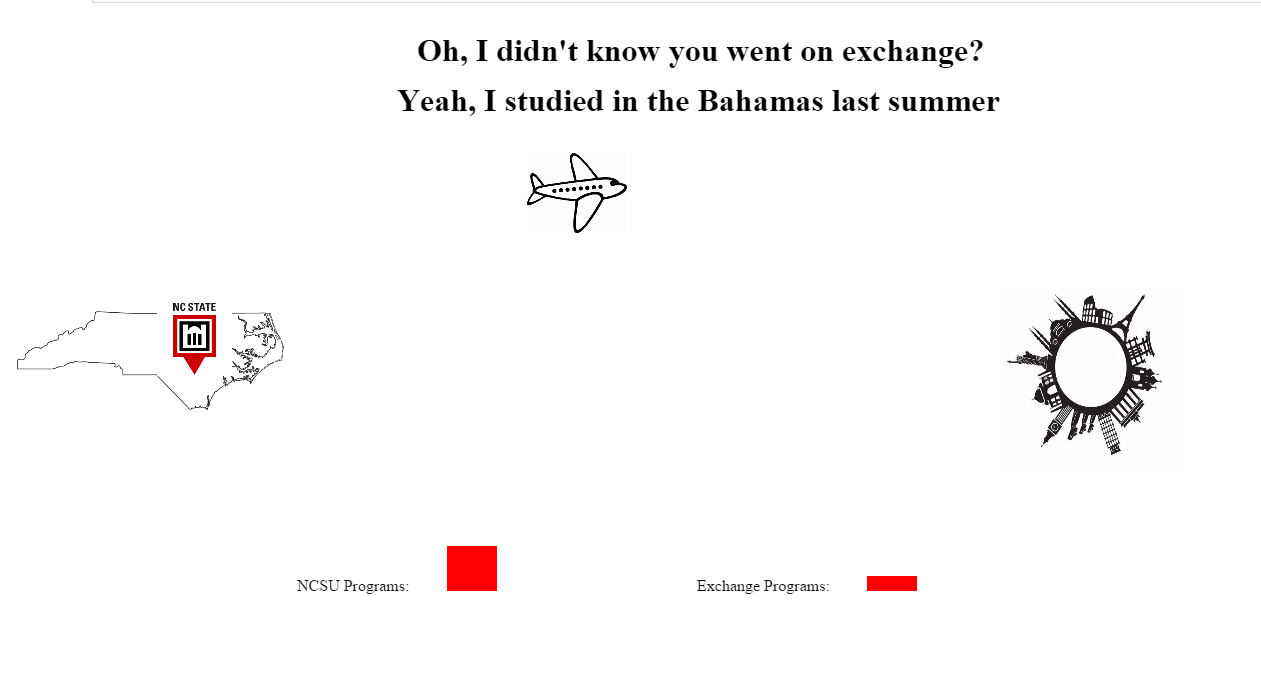
This portion of the data visualization project is designed to represent an NCSU student departing from Raleigh and landing in his or her study abroad location. Each airplane that shoots across the screen correlates to one student who has studied abroad from NCSU. The purpose of these images is to stimulate a generally artistic visualization that shows how a study abroad program can be very different from an exchange—and that those words should not be used interchangeably. Additionally, the visualization shows that the majority of NCSU study abroad programs are internal programs: students from State study with other students from State in academic settings that are set up by NCSU professors.
The data fed to the visualization comes from a dataset that includes all study abroad students from the past five years. However, not each loop is the same: the red airplane represent students who were a part of internal NCSU study abroad programs, while the white airplane represent exchange programs. To create this visualization, we requested data from the study abroad office at NCSU; and we received an excel spreadsheet with information from 5558 students, with 19 columns of information that included gender, ethnicity, major, program location, etc.
We then modified the spreadsheet to remove graduate students and define two new columns, “airplane” and “country.” The airplane column assigned either a “0” or “1” to each student, indicating whether the student participated in an NCSU program or an exchange program. The country column included the host country for all exchange students, but the text “ncsu” for any internal, NCSU program. This sheet was saved as a csv file and then uploaded to p5.js. Once the file was in the p5 program, various functions were used to call data points and images, move certain images, and loop through the full spreadsheet of data.
While the relative worth of an exchange program versus a study abroad program is undoubtedly subjective, there are some key differences, a few of which we have listed below:
- With exchange programs, a study abroad student’s peers are students that attend the host university; with NCSU programs the student’s peers are also NCSU students.
- With the exception of satellite campuses like the Prague Institute, NCSU programs are shorter length
- Students who do exchange programs may experience more culture shock or a harder adjustment, given the lack of familiarity of the environment.
- Students who complete exchange programs generally need to plan how their courses will transfer back to NCSU, whereas all credits from NCSU programs will automatically appear on one’s transcript.
Link: Tableau Visualization
Tableau Description:
We also chose to do a Tableau portion for our final data visualization project in order to show a more complete representation of our Study Abroad data. It was important to us to illustrate the significant disparity between how many students simply study abroad compared to how many (or little) take part in an actual exchange program; however, we also aimed to provide a fuller picture of the data sets we obtained. So, the various sheets on Tableau allowed us to depict more specific variables that affect the Study Abroad program. The main feature of Study Abroad is geographical location, so we wanted to utilize a world map for most pieces of data visualization. The maps helped to highlight specific countries that State’s students have access to in their academic pursuits; and they also contributed to the overall perspective one might have when approaching this visual representation of data. Each sheet contains a different variable, revealing a particular statistic about the program, as listed below.
- Sheet 1: NCSU Study Abroad vs. Exchange Program
- Sheet 2: NCSU Study Abroad- students by country
- Sheet 3: Program term by country
- Sheet 4: Freshman SA by country
- Sheet 5: Sophomore SA by country
- Sheet 6: Junior SA by country
- Sheet 7: Senior SA by country
- Sheet 8: Graduate SA by country
- Sheet 9: Male SA by country
- Sheet 10: Female SA by country
- Sheet 11: Graduate versus undergraduate SA, five-year trend (This concluding sheet was included as a way to show additional information that is most probably overlooked. For us, it was interesting to note that, over recent years, graduate students partake less frequently in SA programs than do undergraduates.)

 Previous Post