Social Network Analysis Project: Sarah I., Rajan, Ellen & Lisa
Social Network Analysis Project: Communication in the Midst of Terror
We selected this topic because unfortunately terrorist attacks have become more and more common with the rise of Isis as well as other smaller terrorist groups. These attacks are chaotic and terrifying as the effects are felt worldwide. Facebook released a feature during the recent Brussels bombings that allowed individuals in Paris to indicate whether they were safe. The advantage of this feature is that individuals were able to communicate their safety quickly and efficiently to a large number of people simultaneously. If we think back even 20 years ago, it could be days or even weeks before friends heard about the safety of their friends in the midst of disasters. Usually, this information would come from news sources or the Red Cross.
However, the use of social media in the midst of terror extends beyond just individuals indicating their safety. What we hoped to learn from our project was what messages people were communicating after a catastrophic event. We chose to use the search term “attaque terroriste.” The attack itself happened on March 22, 2016 at 7:00 UTC. We searched tweets on March 22 from 7:30 to 10:00 UTC. We chose to search tweets in French and during this time frame because we wanted to see how people were using social media who were in close proximity to the attack. Additionally, the data range would have been too large if we had included any other languages or time frames.
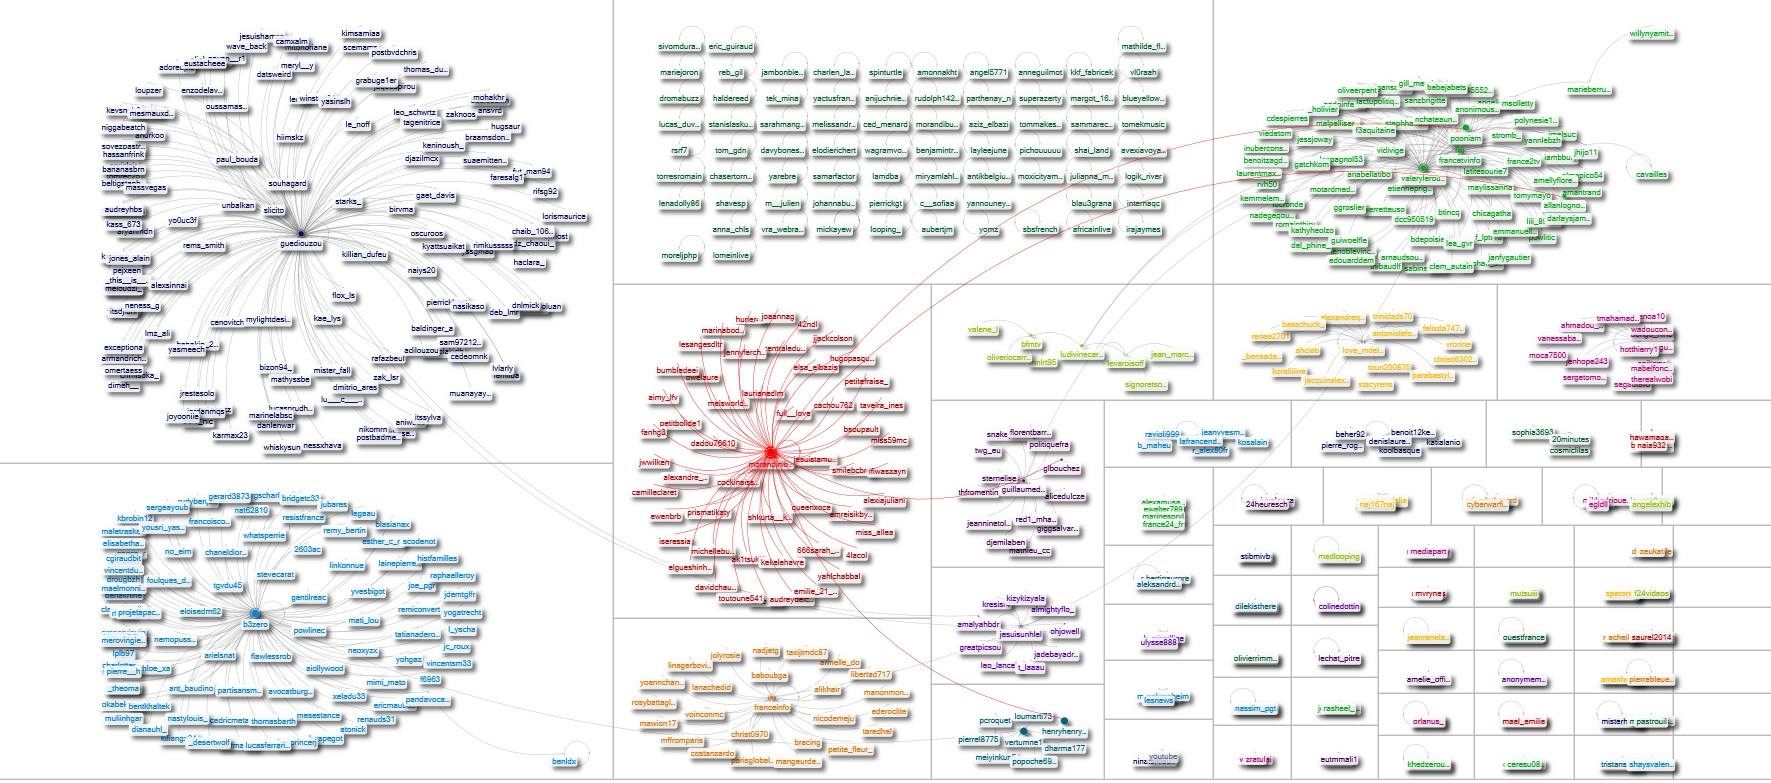
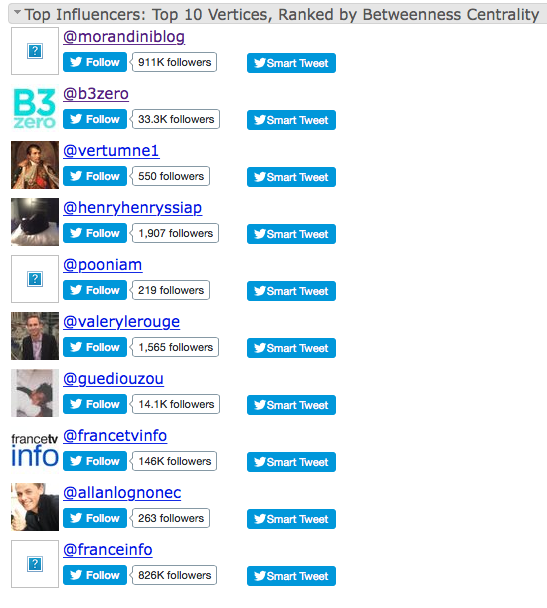
One thing we noticed from our visualization was that there were more retweets, mentions and replies than actual tweets. The first tweet using our keyword following the attack was posted at 7:36 UTC by @amonnakht who tweeted, “Shit terrorist attack in Brussels does anyone have anymore info?” The tweet included graphic images from TFM news. From our data and visualization, we drew the conclusion that tweets were being used mostly to communicate information about the attack as evidenced by this tweet and the layout of the graphs. One person would send out an informational tweet about the attack and then people would retweet and reply to it. Another interesting statistic we found was that there were more positive sentiments (41) than negative sentiments (14), which seems counter-intuitive given the nature of the attack. However, some of the top word pairs in the tweets included “heureusement, au,” which translates to “fortunately, the,” and “des, vigiles,” which translates to “of, vigil.” From this data, it seems that people were thankful that the incident wasn’t worse and that they were praying, which would be considered a positive sentiment. However, it should also be noted that a majority of the keywords were not included in the positive or negative sentiment category and instead were uncategorized. This could be because we chose tweets in French.
One implication of our social media visualization project is thinking about the re-allocation of power. Traditionally big news sources have broadcasted information about attacks and catastrophes, and this is the only information individuals would get about events. The broadcasting companies could control what information was broadcast and how it was presented. However, with the advent of social media individuals with relatively little power, in comparison to big media companies, are able to share information about events as they are happening. In the future it would be interesting to further investigate whether this leads to a more accurate portrayal of events or a more clustered, chaotic chain of information.
Designing this analysis also led to some complications. We began this project with the hope of analyzing many keywords, and many timeframes, but we were unable to do so because of computing capabilities. While NodeXL is a unique program that allows individuals to analyze social networks on personal level of analysis, it cannot perform to the same levels as industry software. The design process included long loading times, and would not function unless a small sample size was used. We were also unable to analyze tweets that were posted more than one week prior to our study. Additionally, we found that there was a terrorist attack in Mali one day prior that inspired number of tweets that met our parameters. It would be interesting to conduct this study again, but with a more powerful computer or more powerful software.
The output statistics from our analysis can be seen below:
Top word pairs:
Top Words in Tweet in Entire Graph:
[41] Words in Sentiment List#1: Positive
[14] Words in Sentiment List#2: Negative
[0] Words in Sentiment List#3: Angry/Violent
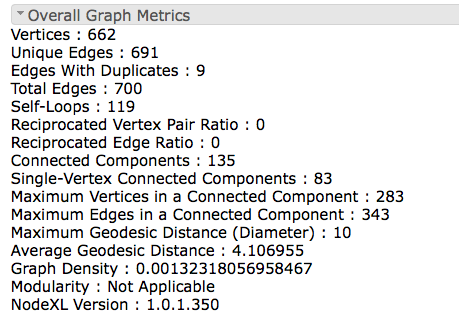
Our overall graph metrics can be seen below:
 Previous Post