Social Network Analysis: #NotTodaySatan
Group Members: Kayla Akers, Margaret Mainguy, Katie Hart, Alexandra Goodfred

2. Through our Social Network Analysis, we explored how a simple, but popular hashtag has spread very quickly on Twitter. By using the hashtag, #NotTodaySatan, we were able to see how many people were using this hashtag and how it was spreading from one more central tweet to many others as it grew and became much popular. Our SNA could allow a company or even an individual knowledge on who to target to send a sample of a product for testing purposes or to start a new catch phrase, because as we all know language is living and ever changing. By looking at the portion of the social media analysis that is much more clustered together from afar, you would want to target one or two of these individuals who have the greatest impact in the group. Donald Trump’s twitter page showed up in the top ten vertices measured by betweenness centrality as number five. As much as it isn’t pleasant to admit, he has a lot of power on Twitter. With his immense twitter presence, it would be wise to target someone like him to make things happen. Though for other reasons, he wouldn’t be a company’s wisest choice. The use of the top ten individual twitter accounts on the betweenness centrality measurement would be the best list to analyze to decide who to target with products, ads, or anything else that is desired to be shared.
However, the question can be raised that since these figures can change very quickly how can a company truly target any one person and expect them to have a continued high social media influence. From the time we originally pulled up the data in class on March 23 to when newer data was pulled up, there was only one individual listed on both lists. The knowledge acquired from using the graph could allow for the question of whether or not they should target just the individuals who maintain the higher influence or target all who have shown high levels of influence. It would just depend on what you were choosing to use this information for and what was the desired result. Without knowing that information, it is relatively impossible to say exactly can or cannot be done with this graph and/or information.
We selected this topic, because we had a discussion about how silly hashtags are and how they spread among people. We viewed several other hashtags, before we settled on #NotTodaySatan. As we took the time to read through some of the tweets included the hashtag, we noticed the amount of retweets on some of the originals and talked about how the information from one tweet where there is some shared emotion or experience could continue to expand and become more popular by being shared with many others. It may seem like a silly hashtag to look at, but it is one that is very popular at the moment and allows for a community not based on tragedy or some event, but of shared experience and in some ways a shared mindset.
3. The search term we used was #NotTodaySatan and the date range covered was April 9 through April 18.
4. The graph metrics that we chose to focus on was the use of betweenness centrality, closeness centrality, and also the number of followers each individual has on twitter. We just thought that the individuals who has the highest numbers or were ranked higher would be those who would be targeted by the companies or anyone else.
5. Through our SNA, we able to identify 524 unique edges, 34 duplicate edges, and there was 575 vertices. Out of all of these edges and vertices created, there were only 381 of those connected to others. The maximum amount of people connected with one another was 17, which allows for understanding of those who are connected together. Next to talk about betweenness centrality, these were the top ten vertices.
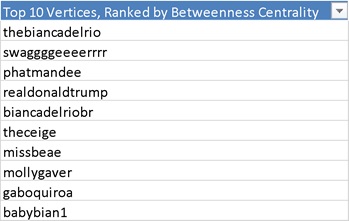
In our opinion, if a company was to target someone these would probably be those that would be targeted as of when our data was collected.