Data Visualization Via Facebook Photos
I’ll first look at strictly the photos, and then I’ll look at data interaction such as location or tags. As I look at photos, I’ll try to point out large trends because I’m not sure how accurately these photos can detect preferences.
I’ll begin with the first aspect of my Facebook photos that I noticed: I wear a lot of suits. Well, actually, I don’t. But if you were to judge solely on my Facebook photos, it sure looks like I do. In the past year I’ve worn a suit no more than 10 days (3 interviews, 2 weddings, and about 5 formal events come to mind). That means about 3% of my year is spent wearing a suit. However, about 20% of my Facebook photos show me in a suit. The fact is, I’m in a lot of pictures when I’m at formal events.
The next easy takeaway: I go to State. I’m not sure whether or not visual data algorithms can detect the detail of NCSU’s logo or text, but if nothing else, it’s pretty obvious that I like red. The color jumps out of a number of my Facebook photos, and if I’m not in red, someone else in the photo often is.
Trend #3: Just about all of my photos are with groups of people. I would say about 50% of my photos are just me and one other person, and another 20% are group photos of 10+ people.
Here’s a photo from last semester that sums up all 3 of those points:
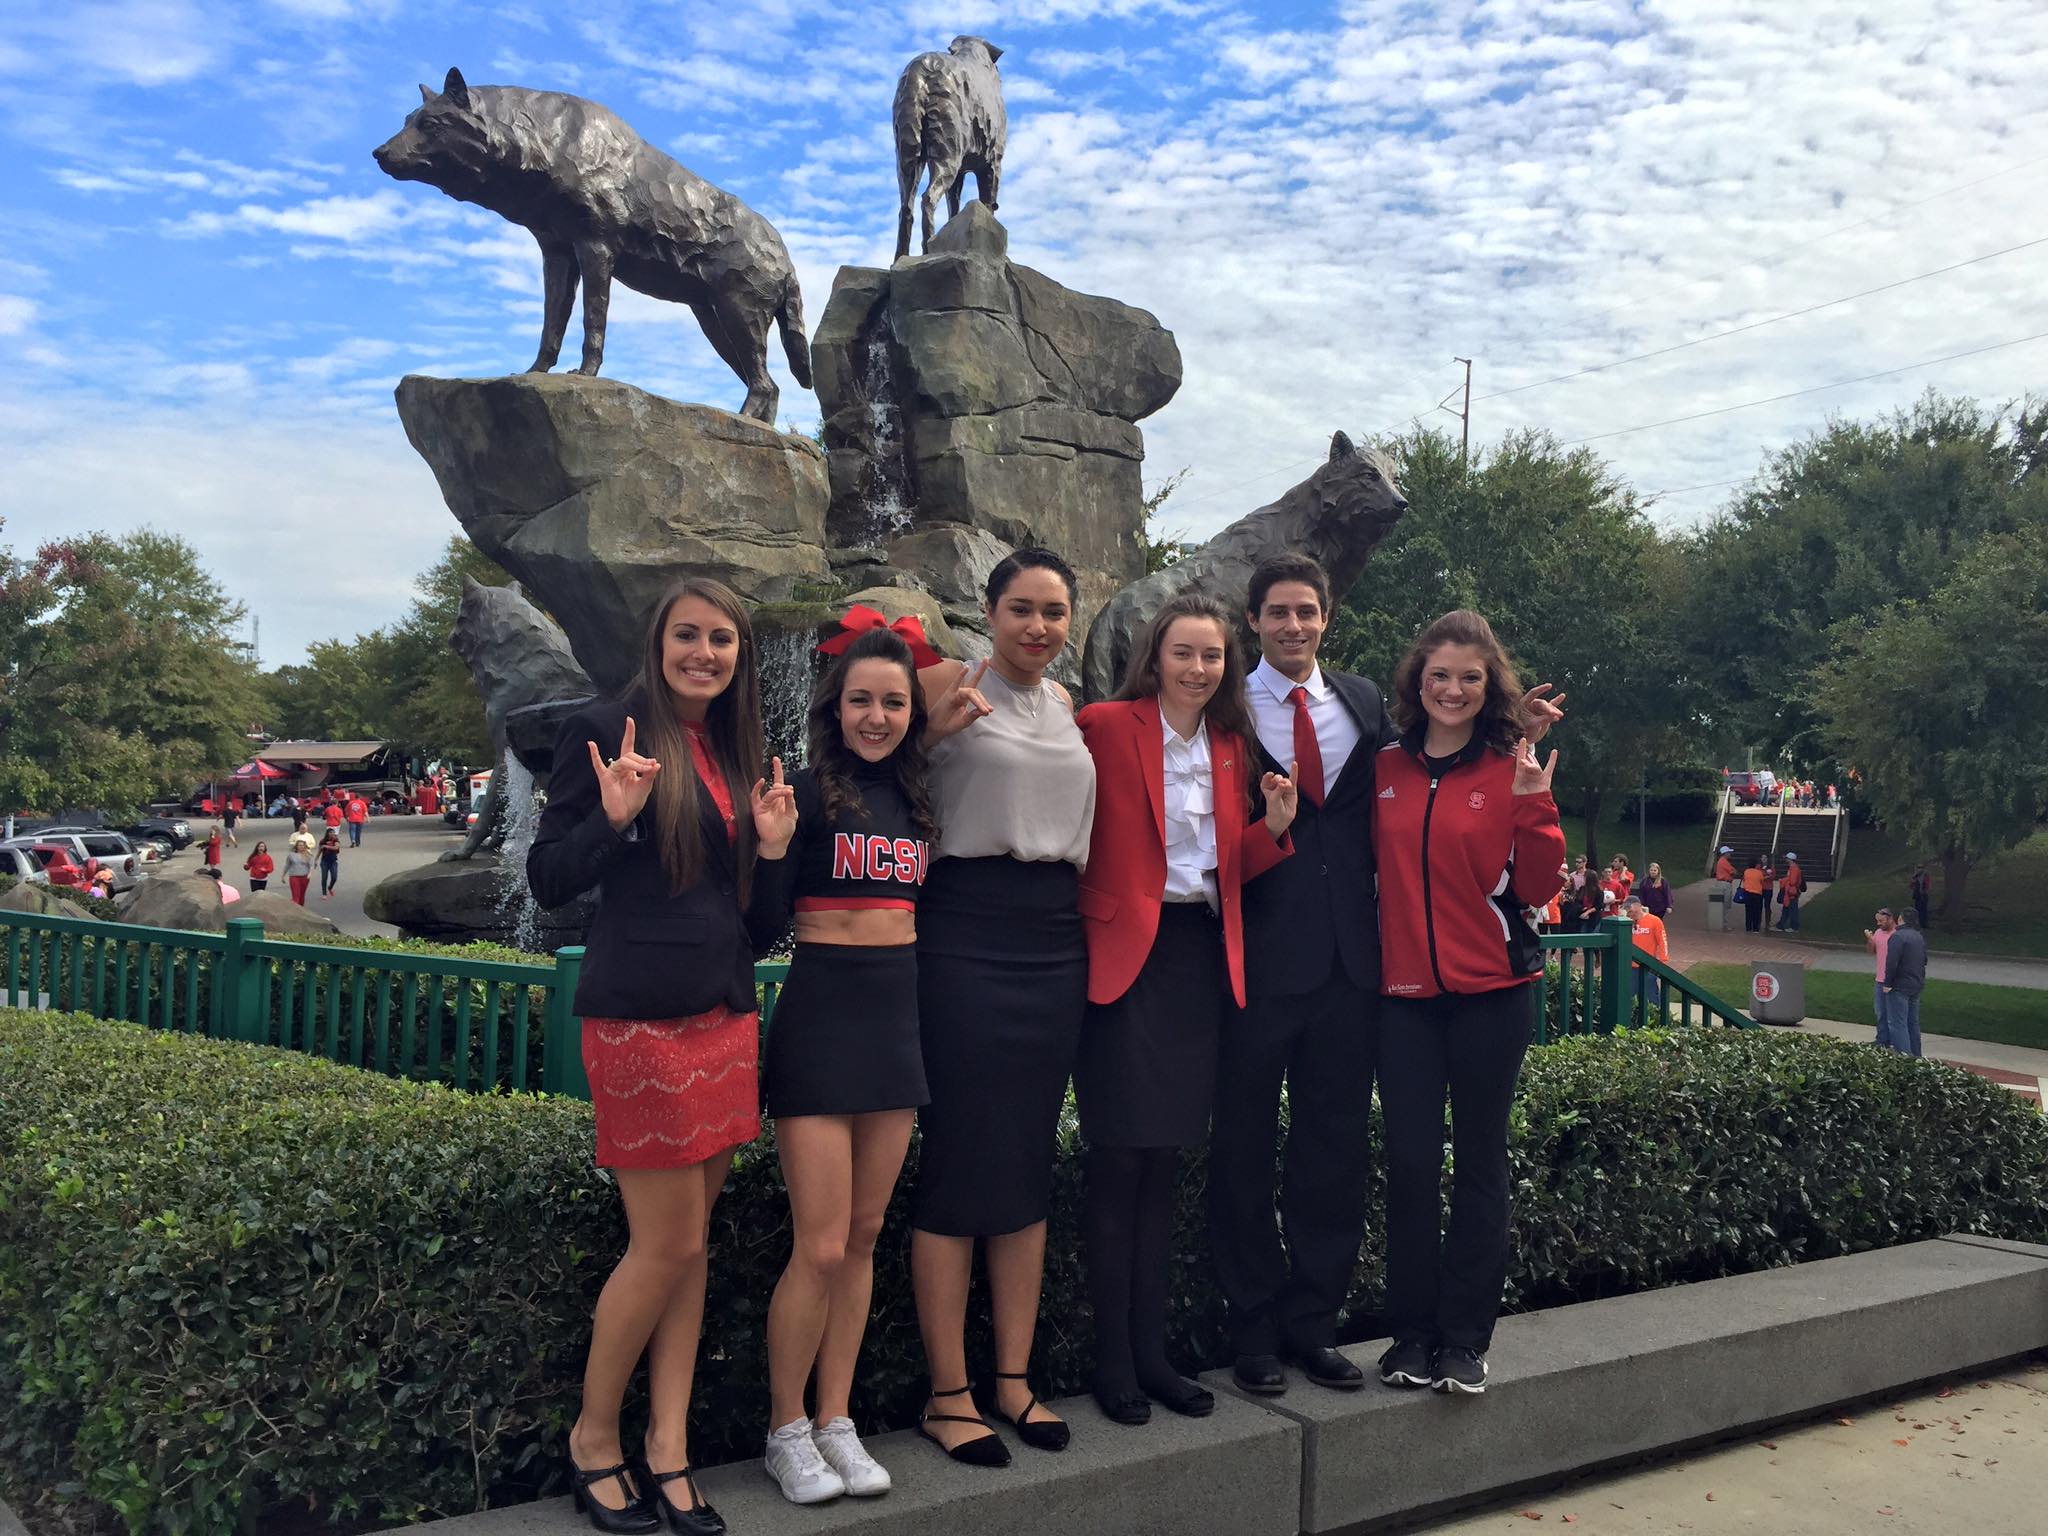
The next point I’d like to elaborate on is tags, the reason why trend #3 may be so important. I don’t add Facebook photos, post many statuses, add locations, but my friends do. And since almost all of my Facebook photos are with other people whom are tagged, there’s potential for data interaction to draw more conclusions on me and my friends. Do you know where that photo was taken? Probably some of you do having recognized the wolves statue. It’s Carter-Finley. Can an algorithm recognize the wolves statue as quickly as you can? Probably not, but it can easily recognize my friend’s status about the homecoming game at Carter-Finley. I don’t think the importance of tags can be stated enough. The more data interacts, the more accurate these algorithms become.
 Previous Post
 Next Post
I think it’s pretty interesting you and I both talked about how whenever we are dressed formally, we tend to post a picture of it. I do not always wear suits either, but you can bet that when I do, I’m taking a picture that day. I was actually pretty interested in your idea of an algorithm recognizing your location, like your example of the wolves statue at Carter-Finley. I had never thought of this before, but it has to possible for more popular locations, right? Anyways, I just thought it was a creative concept.
Overall I really liked this post. It helped me expand my thought process on how data visualization effects us daily.
I like you point about how when data intersects it makes the algorithms within the platform more effective. That’s an interesting concept of how the culmination of your own posts referenced with the posts of your friends can create a data pool of information that makes up your lifestyle.
Your analysis was spot on! I think you did a great job of breaking down the trends you saw in your photos and then realizing how they all came together. As data becomes more and more intertwined, it will definitely have ways of piecing together information about you, without having to just look at your profile for the answers.
Also, I read your post in a Detective/Film Noir style voice and so it was very amusing. Good job!